Last year, I did an analysis that included the topic of wafer-to-wafer bonding. Specifically, it was a comparison of the three variations available when stacking wafers and/or die—wafer-to-wafer (W2W), die-to-wafer (D2W), and die-to-die (D2D). The goal of that project was to build cost models for W2W and D2W (with the understanding that D2D had similar cost drivers to D2W), and perform a comparison across key variables. Then, the scenarios in which each was the most cost-effective were supposed to be highlighted. Unfortunately, within the chosen parameters, there were almost no occasions in which W2W was the most cost-effective.
Those results prompted this analysis that focuses solely on W2W. The W2W process has the potential to be the best option if only very good yields can be achieved. Therefore, instead of directly comparing it to the other options, I decided the W2W process needed to be more fully analyzed on its own.
Bonding Methods
Before diving into the W2W analysis, I’d like to make a few comments about the other available methods.
As stated in the introduction, the W2W process flow has some clear advantages. It has the highest throughput and allows for the greatest alignment accuracy. Arguably the most prominent disadvantage is yield. There is no ability to match known good locations on one wafer to known good locations on another wafer.
In direct contrast to the W2W yield disadvantage, the D2W and D2D process flows have a distinct yield advantage. In both situations, known good die/known good wafer locations can be utilized, and most bad die end up being scrapped before additional cost is lost later in the process flow. Another difference and potential advantage is that different sized die can be bonded together. The disadvantage for both of these processes is throughput. Despite there being a range of potential throughputs and alignment accuracies, W2W still tends to have the highest throughput.
W2W Bonding Technology
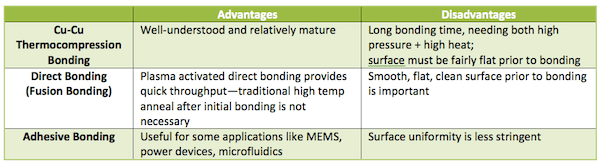
I constructed a generic W2W bonding cost model for this study. Generic means it includes enough variables to reflect different bonding methods, but doesn’t represent any single one. A few of those methods are mentioned in Table 1, along with key points to consider.
The main variables that will be evaluated are: incoming wafer cost, incoming wafer defect density, time required for bonding, equipment cost for bonding, and the yield of the bonding process.
Cost Model
Activity-based cost modeling was used to construct a generic W2W bonding cost model. With activity based cost modeling, a process flow is divided into a series of activities, and the total cost of each activity is calculated. The process flow can be described by the following steps/groupings of steps (Table 2).
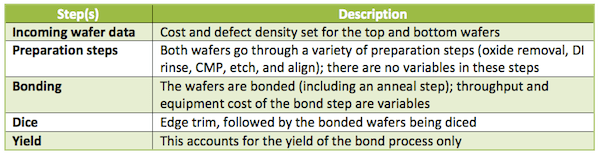
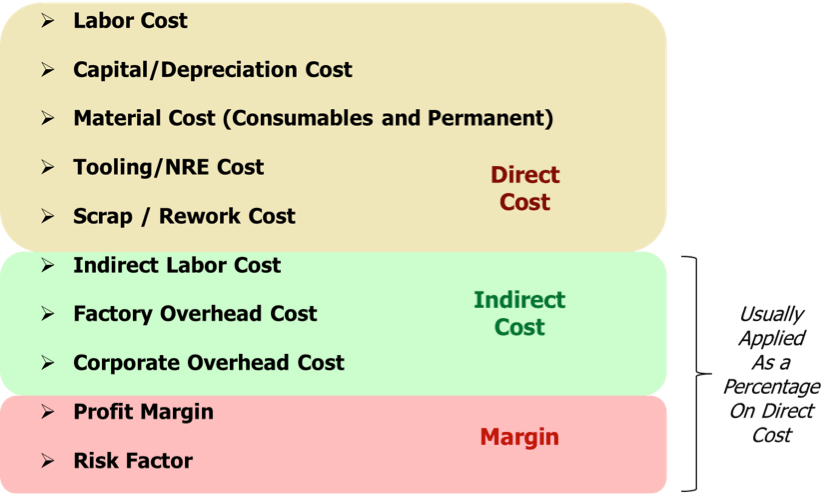
The costs explored in this study are all direct costs, which means no overhead to account for profit margin or indirect costs is applied (see picture below). All results are presented as a cost per two-die stack. The model assumes a well-balanced and fully utilized line, and all steps are set to industry standard equipment, material, and throughput values (Figure 1).
Sensitivity Analysis
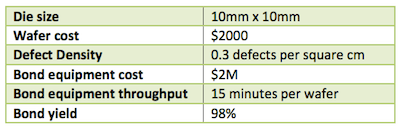
A sensitivity analysis was carried out on each of the variables to study the level of impact each has on the resulting bonded die cost. The assumptions used for these sensitivity analyses are presented in Table 3.
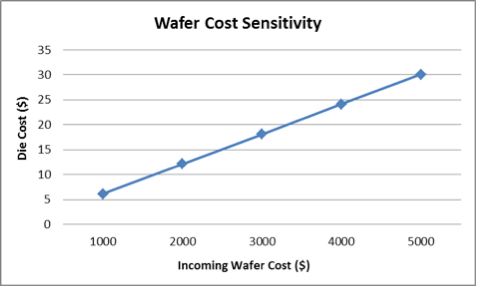
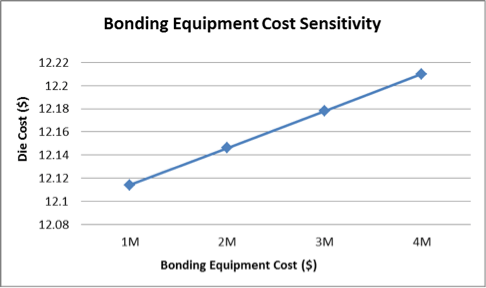
The impact of incoming wafer cost is linear and relatively straight-forward (Figure 2). The impact is high because the cost of an incoming wafer is a large portion of the resulting die cost—the wafer brings a cost with it, and then processing costs are added on top of that. It’s essentially a huge material cost. The impact of equipment cost is similarly linear, but it has a much lower impact (Figure 3).
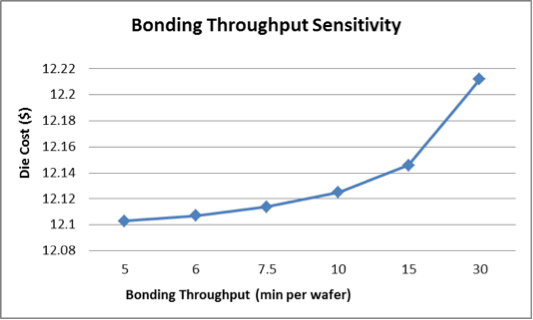
Bonding throughput has an impact similar to that of equipment cost—the change between spending 5 minutes per wafer (12 wafers per hour) or 30 minutes per wafer (2 wafers per hour) is only around ten cents (Figure 4).
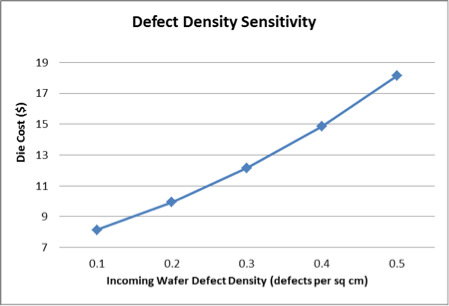
The final two sensitivity analyses are both yield factors—one focuses on the defect density of the incoming wafer (Figure 5), and the other on the yield of the bonding process (Figure 6). Defect density is related to the quality of the incoming wafer and measured in defects per square centimeter. This is particularly important in W2W bonding because there are defects to consider on both the top and bottom wafers.

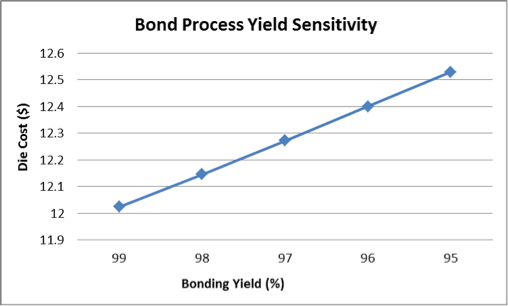
Bonding yield, on the other hand, is measured in percentage. This is related to the bonding process itself. Simple, clean bonding processes are likely to have higher yields, while those that introduce other elements—heat, high pressure, or materials such as adhesives—have the potential to reduce yield.
While both defect density of the incoming wafers and the yield of the bonding process have an impact on the resulting die cost, defect density has a much greater impact.
Cost and Yield Trade-offs
Now that each variable has been analyzed individually, a few scenarios were developed to study the impact of changing multiple variables at once.
Scenario 1
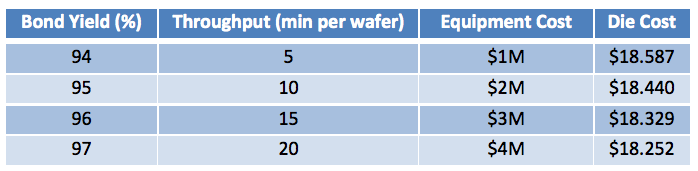
This is a simple trade-off between equipment cost and throughput. The goal was to understand when it may make sense to pay more for increased throughput. This example uses an 8mm x 8mm die (Table 4).
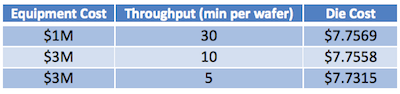
The first two rows show a situation where the resulting cost is barely affected—when the cost of the equipment increases but results in a lower throughput, the die cost is almost the same. This is a situation in which either piece of equipment—the cheap one with the slower throughput or the more expensive one with quicker throughput—would suffice. The third row shows the cost of the die if the same $3M piece of equipment was able to achieve an even faster throughput of 5 minutes per wafer (12 wph). In this case, die cost is reduced, but only by about 2.5 cents. This is an example of when it may not make sense to pay $2M extra for such an impressive throughput increase when the impact on the die cost is so limited.
Scenario 2
This scenario considers the relationship between the yield and the throughput of the bonding process. The assumption here is that a more expensive piece of equipment may be used that brings with it the capability to achieve higher yields at the expense of throughput. Throughput may be affected by factors such as the speed of the temperature ramp for a Cu-Cu thermocompression process or the necessity of applying pressure (Table 5).
Each row shifts from a lower yield associated with a cheaper piece of equipment and quick processing time to an improved yield that comes with more expensive equipment and slower processing. Each of these steps results in anywhere from 14 to 7 cents of improvement in spite of the increase in both equipment cost and processing time per wafer. This shows the importance of yield.
Scenario 3
This is not a direct comparison in the same way as the previous scenarios, but a deeper look at the relationship between defect density and die size.
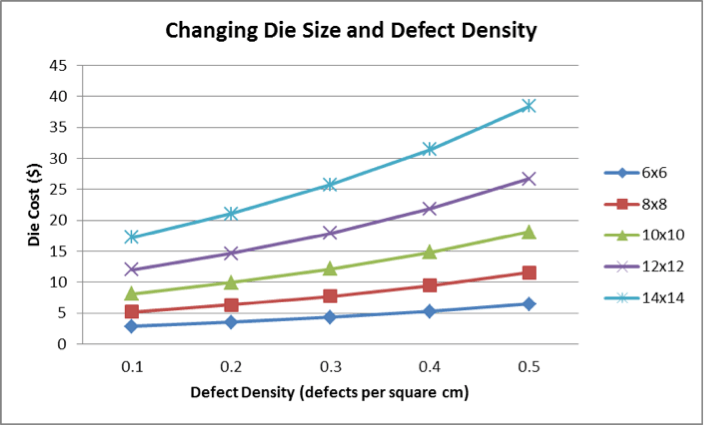
The main takeaway from this chart is that larger die sizes are more sensitive to changing defect density. This is because, when dealing with small die, a defect occurring once takes out a small part of the wafer—a small die. When dealing with larger die, one defect can take out a larger portion of the wafer, therefore increasing cost more quickly.
Conclusion
While there are a few conclusions that can be drawn from this analysis, the major takeaway is that W2W bonding is heavily dependent on defect density. For W2W to compete with processes that allow for use of known good die, the wafers must have a low defect density. This leads to a related conclusion that W2W bonding is particularly suitable for smaller die sizes, because sensitivity to defect density increases as die size increases. ~ A. Palesko